
Charlotte County Inventory & Days on Market: October 2026 Report
2,948 active listings, 4.9 months of supply, 91 median days on market. Here's how fast Charlotte County homes are selling this October and what it means for you.
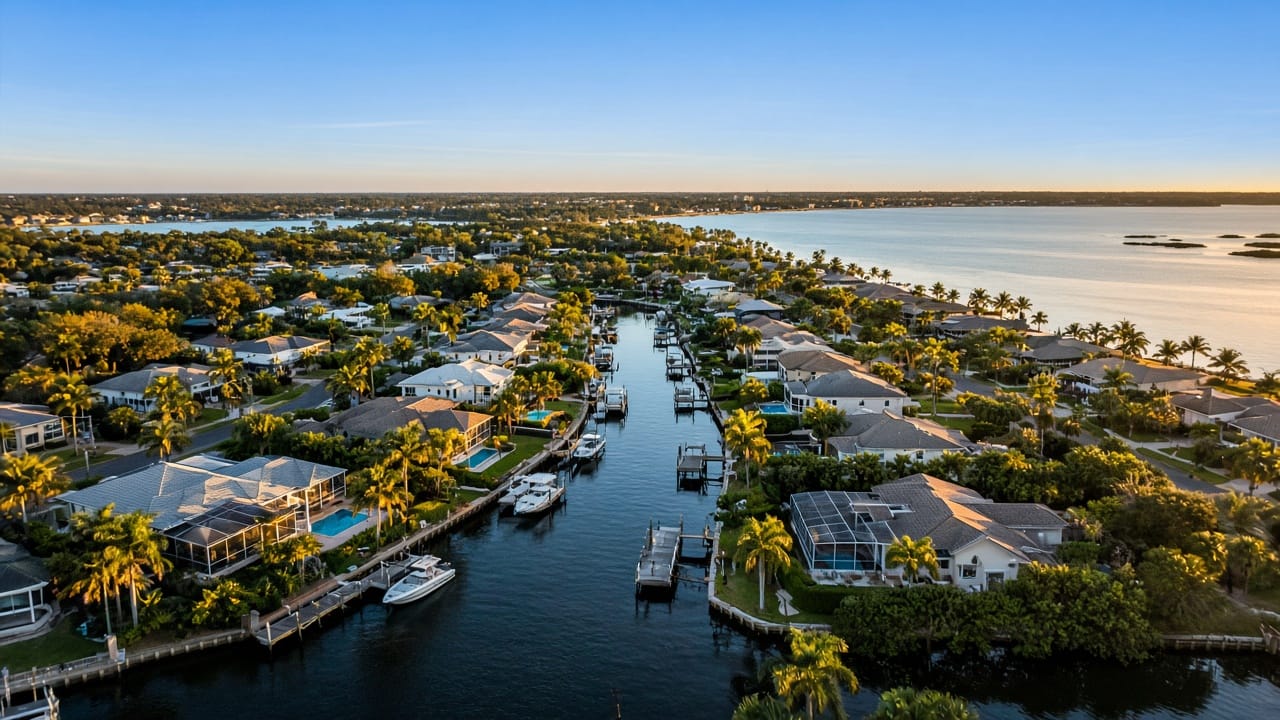
Charlotte County homes are selling at a steady, unhurried pace this October: 2,948 active listings, 4.9 months of supply, and a median of 91 days on market. That is a balanced market, where homes priced right sell and homes priced on hope sit.
Key Takeaways
- 2,948 active listings countywide as of October 14, 2026, with Port Charlotte (1,274) and Punta Gorda (1,116) making up most of that inventory.
- 4.9 months of supply puts Charlotte County squarely in balanced territory. Neither buyers nor sellers hold all the cards.
- Median days on market is 91 countywide. Port Charlotte moves fastest at 79 days. Punta Gorda sits at 96, and waterfront homes take the longest at 111.
- Sales volume is flat year over year (0%). Buyers are still buying at about the same pace as last year. They just are not rushing.
- Median list price is $340,000 and median sold price is $312,500. Pricing right from day one matters more than anything else in this market.
- New construction is a real factor: 757 active new-build listings at a $369,999 median list price are competing with resale homes.
The Inventory Picture: 2,948 Homes on the Market
Here's what matters first. There are 2,948 homes actively for sale in Charlotte County right now, based on tax records, county records, and MLS data as of October 14, 2026.
That is a healthy number of choices. Buyers can see several homes in a weekend, compare them, and go back for a second look without feeling like they have to write an offer in the driveway.
Here's how that inventory breaks down:
| Area | Active Listings | Median List Price | Median Days on Market |
|---|---|---|---|
| Charlotte County (all) | 2,948 | $340,000 | 91 |
| Port Charlotte | 1,274 | $325,000 | 79 |
| Punta Gorda | 1,116 | $349,900 | 96 |
| Waterfront (all areas) | 842 | $549,900 | 111 |
| New construction | 757 | $369,999 | n/a |
A few things jump out when I look at this table.
Port Charlotte and Punta Gorda together account for 2,390 of the county's 2,948 listings. The rest is spread across Englewood, Rotonda West, the islands, and the rest of the county.
Waterfront homes are 842 of the total. That is close to three in ten listings. If you are shopping on the water, you have real selection right now.
New construction makes up 757 listings, roughly a quarter of what's for sale. That is a lot of fresh product, and it shapes how resale sellers need to price and present their homes.
Months of Supply: What 4.9 Actually Tells You
Months of supply is the simplest way to read a market. It answers one question: if no new homes came on the market, how long would it take to sell everything that's listed today at the current pace?
Charlotte County sits at 4.9 months.
The general rule of thumb in real estate goes like this:
- Under about 4 months: sellers have the edge. Multiple offers are more common, and homes go fast.
- About 4 to 6 months: balanced. Fair prices get fair offers, and negotiation goes both ways.
- Over about 6 months: buyers have the edge. Price cuts and seller concessions become the norm.
At 4.9, we are right in the middle of that balanced band. The snapshot labels Charlotte County, Punta Gorda, and Port Charlotte all as balanced markets.
If you do the rough math, 2,948 listings divided by 4.9 months works out to somewhere around 600 closings a month at the current pace. That is a back-of-the-napkin figure, not an official count, but it tells you buyers are active. Homes are moving every week.
Add the flat year-over-year sales trend (0%) and the picture is steady. Not hot. Not cold. Just a normal market where people buy homes for normal reasons.
How Fast Homes Are Selling, Area by Area
The county median of 91 days is useful, but it hides real differences between areas. Here's what I see in each slice.
Port Charlotte: 79 Days
Port Charlotte is the quickest-moving part of the county right now, with a median of 79 days on market and a median list price of $325,000.
That makes sense. Port Charlotte has a wide range of homes at prices that work for a lot of buyers. When a home there is clean, priced right, and shows well, it tends to find a buyer faster than the county average.
One thing I always remind Port Charlotte buyers: not every canal is the same. Saltwater powerboat canals have 10-foot bridges, so check the clearance for your specific boat before you fall in love with a house. Saltwater sailboat-access canals have no bridges and a clear path to Charlotte Harbor and the Gulf of America. Freshwater canals end at a culvert under Tamiami Trail (US-41), so boats cannot get through to the harbor at all. Those differences affect who the buyer pool is, and that affects days on market.
You can dig into the full numbers on my Port Charlotte market data page.
Punta Gorda: 96 Days
Punta Gorda has 1,116 active listings, a median list price of $349,900, and a median of 96 days on market.
Punta Gorda takes a little longer than Port Charlotte. Part of that is price point. Part of it is that Punta Gorda buyers tend to be specific. Many want a certain canal, a certain boating route, or a certain community, and they will wait for the right fit.
In Punta Gorda Isles, for example, the powerboat section has 13-foot fixed bridges, including the Marion Ave Bridge, while the sailboat-access section has no bridges. A buyer with a tall boat is shopping a much smaller slice of inventory, and that slows things down for both sides.
Waterfront: 111 Days
Waterfront homes across the county have a median list price of $549,900, 842 active listings, and the longest median days on market at 111.
I tell clients this is normal. Waterfront buyers do more homework. They look at seawall condition, dock and lift, boating route, insurance, and flood zone. They often bring in inspectors and contractors before they commit. All of that takes time.
If you are selling on the water, plan for a longer runway than a non-waterfront home. If you are buying, 842 listings gives you real room to be choosy. Start with my waterfront homes page to see what's out there by area.
New Construction: 757 Listings
New construction has 757 active listings at a median list price of $369,999. That is about $30,000 above the countywide median list price.
Builders can offer things a resale seller usually can't: incentives, rate buydowns, and a brand-new roof and systems. That means resale sellers in similar price ranges need to be sharp on price and condition. A ten-year-old home priced like a new build will sit.
The Gap Between List and Sold
The countywide median list price is $340,000. The median sold price is $312,500.
Those two numbers are not a perfect apples-to-apples comparison. The list median covers homes for sale today, and the sold median covers homes that already closed. Different homes, different mix.
Still, the difference is worth noticing. It lines up with what I see across the desk every week: sellers often list with a number in mind, and the market settles a bit lower. The homes that sell closest to asking are the ones priced correctly on day one.
In a balanced market, the first two to three weeks are when your home gets the most attention. Miss on price there, and you spend the next two months chasing the market down.
What I Tell Clients Right Now
I've been licensed since 2002 and selling waterfront real estate in Charlotte County that whole time. Here's the plain advice I'm giving this October.
If You're Selling
- Price for the market you have. With 4.9 months of supply, buyers have options. They compare your home to five others before they book a showing.
- Expect around three months. The county median is 91 days. Port Charlotte is a bit faster, Punta Gorda and waterfront a bit slower. Plan your move with that in mind.
- Fix the obvious stuff. Buyers in a balanced market will walk past a home with deferred maintenance when there's a similar one down the street that's ready.
- Know your competition. If new construction is close by in your price range, your home needs to show its value clearly, whether that's lot size, location, water access, or upgrades.
- Get a real number. Before you pick a list price, find out what your home is worth based on what's actually selling, not what neighbors are asking.
If You're Buying
- You have time to think. With homes sitting a median of 91 days, you can do your inspections and insurance quotes without panic.
- Negotiation is on the table. In a balanced market, asking for repairs, credits, or a price adjustment is reasonable, especially on homes that have been listed a while.
- The good ones still move. Balanced doesn't mean slow for everything. A well-priced home in great shape can still draw quick interest. Be ready with your financing lined up.
- Know your boat before you shop. If you're buying on the water, measure your boat's height and beam first. Then match it to the right canal system.
- Compare new and resale. With 757 new builds on the market, look at both. Sometimes a builder incentive wins. Sometimes a resale home on a bigger lot or better canal wins.
What to Watch Over the Next Few Months
October is a turning point here. Seasonal buyers start showing up as the weather cools, and showing activity usually picks up through the winter months.
Here's what I'll be watching:
- Months of supply. If it drifts toward 6, buyers gain more leverage. If it drops toward 4, sellers get a little more breathing room.
- Days on market in Port Charlotte vs Punta Gorda. The gap between 79 and 96 days tells me where buyer demand is strongest.
- Waterfront inventory. With 842 listings and 111 days on market, this is the slice where pricing discipline matters most.
- New construction volume. If builders keep adding product, resale sellers in overlapping price ranges will feel it.
I'm not going to predict where prices go. Nobody can do that honestly. What I can do is watch these numbers closely and tell you what they mean for your specific home or search.
Keep Up With the Numbers
Markets change month to month, and so do these figures. For my regular reports and commentary, check the latest market updates. For the full countywide breakdown, including price trends and inventory over time, visit the Charlotte County market statistics page.
Thinking about selling this season, or want to know how your neighborhood compares to the county numbers above? Contact Leo directly and I'll walk you through what's selling near you, how long it's taking, and what a smart list price looks like for your home.
Leo Albanes
Broker-Owner, Charlotte County Properties Inc.
Florida Real Estate Broker License #BK3054900
Over 20 years helping buyers, sellers, and investors navigate Charlotte County. Punta Gorda-based. Se habla español.


